
Fleet Recognition Score
Whether your fleet is building cumulative brand recognition, or generating isolated impressions that do not compound.
A vehicle wrap is seen every time a driver passes the vehicle, and in a dense suburban market like DFW, a service vehicle on daily routes is passed by a large number of people, repeatedly, for years. The question is not how many sightings the fleet generates, it is whether those sightings are building toward something.
Brand recognition is cumulative. A prospect who sees the same company's truck three times over six months, each time associated with professional appearance and a clear, consistent identity, is far more likely to call when a need arises than one who sees three different-looking vehicles that happen to belong to the same company.
The Fleet Recognition Score evaluates whether a fleet is set up to build that cumulative recognition. It measures four dimensions: visual consistency, market saturation, touchpoint alignment, and brand recall signals.
The four dimensions of fleet recognition
Visual consistency
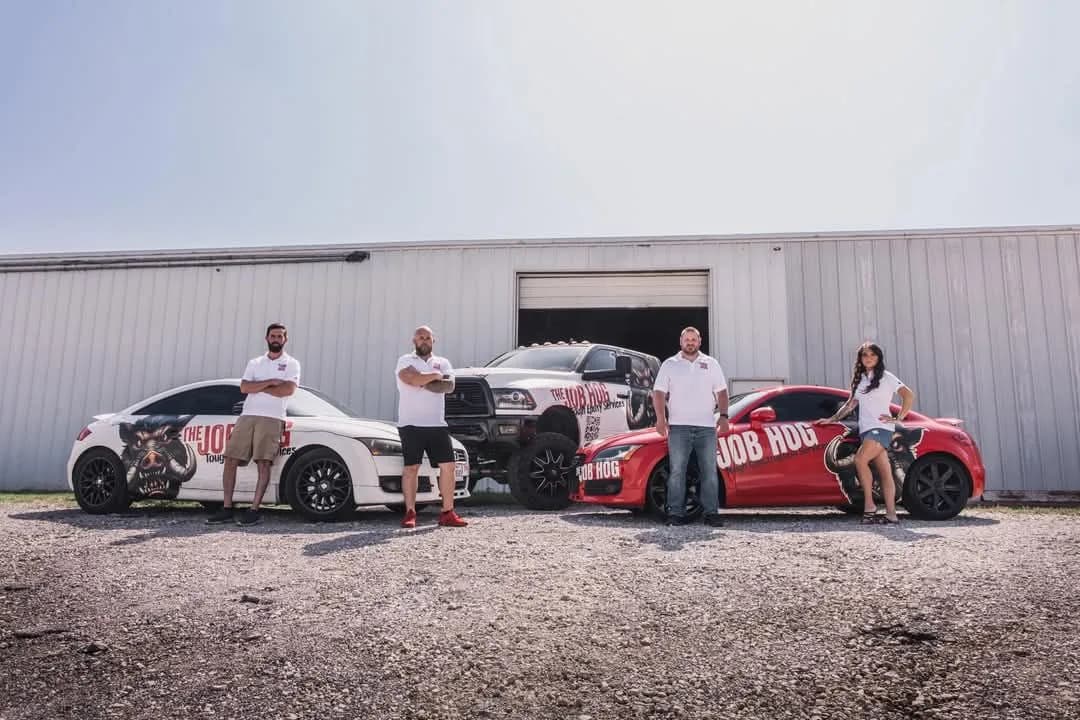
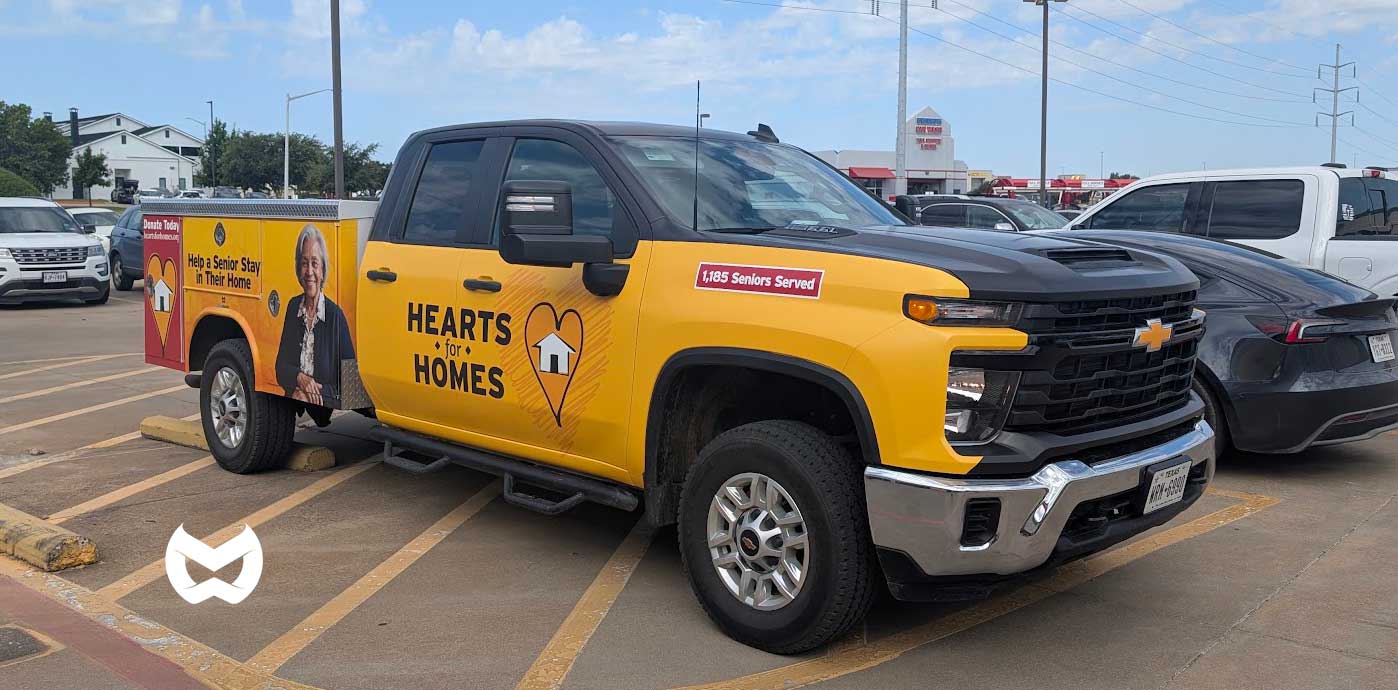
35% weightWhether every vehicle in the fleet is immediately recognizable as the same company. Recognition is cumulative, each sighting builds on the last, but only if every vehicle presents the same visual identity. One vehicle with a different color, logo treatment, or layout breaks the pattern and forces the viewer to re-learn the brand.
Strong indicators
- All vehicles use the same primary color system with no visible variation.
- Logo appears in the same position and version on all vehicle types.
- Company name and service category are in the same relative size and placement across all vehicles.
- Vehicles added to the fleet in different years match the existing livery.
Red flags
- Different logo versions on different vehicles.
- Older vehicles in the fleet showing faded or discontinued color versions.
- Acquired vehicles from a previous brand not yet re-wrapped.
- Specialty vehicles (trailers, box trucks) in a different livery than the primary fleet.
Market saturation
30% weightWhether the fleet operates at sufficient density in the target service area to produce repeated sightings for a typical prospect. A single truck in a large market generates individual impressions that are rarely repeated for the same viewer. A fleet with geographic concentration makes it possible for a prospect to see the brand multiple times before a need arises.
Strong indicators
- Fleet vehicles are routed through the target service area during peak residential traffic hours.
- The number of vehicles per square mile of service area is sufficient for repeat sightings.
- Vehicles are not primarily parked or operating in areas outside the service area.
- Fleet size is growing proportionally with the service area.
Red flags
- All vehicles operating from a single hub with overlapping routes.
- Significant portion of daily miles outside the target service area.
- Fleet size has not kept pace with service area expansion.
Touchpoint alignment
20% weightWhether the fleet livery is consistent with the company's other brand touchpoints: website, uniforms, yard signs, invoice templates, and social media. A prospect who sees a truck and then looks up the company needs to land on a website that looks like it belongs to the same company. Misalignment between touchpoints creates doubt and reduces the conversion rate of fleet impressions to calls.
Strong indicators
- Website uses the same color system and logo as the fleet.
- Technician uniforms match the fleet color and carry the same logo.
- Yard signs placed at job sites are consistent with the fleet livery.
- Proposal and invoice templates use the same visual identity.
Red flags
- Website was last updated before the most recent fleet redesign.
- Uniforms from a previous brand version still in use.
- No yard signs at job sites, missing the secondary impression opportunity.
- Social media profile uses a different logo version than the fleet.
Brand recall
15% weightWhether the fleet is generating the 'I see your trucks everywhere' response from customers and prospects. This is the outcome of strong visual consistency and market saturation over time. It is the point at which the fleet advertising transitions from generating individual impressions to building a brand position in the market.
Strong indicators
- New customers mention seeing the trucks before they needed the service.
- Existing customers comment on the fleet visibility in the community.
- The brand is referenced in local social media groups as 'the company with the trucks.'
- Inbound inquiries cite the fleet as the first point of awareness at a meaningful rate.
Red flags
- No customers cite 'saw your truck' as an awareness source despite significant fleet operations.
- No social mention of the fleet in local community groups.
- Customers who have seen the truck cannot consistently recall the company name.
The highest-leverage improvement for most fleets
For most home service companies operating in the DFW market, the highest-leverage improvement to fleet recognition is visual consistency. Getting every vehicle in the fleet into the same livery, same colors, same logo version, same layout logic, has a compounding effect on recognition that no individual vehicle improvement can match.
The second highest-leverage change for most companies is touchpoint alignment. A consistent fleet that points to an inconsistent website, or a set of technicians in mismatched uniforms, breaks the recognition chain at the conversion point. The fleet builds the impression; the touchpoint alignment determines whether that impression converts to a call and a sale.
WrapMasters' approach to fleet work starts with a recognition audit that covers both the vehicle wraps and the full touchpoint system. The goal is not better-looking trucks. It is the "I see your trucks everywhere" outcome that compounding consistent recognition produces.
Common questions
- What is the Fleet Recognition Score?
- The Fleet Recognition Score is an evaluation framework WrapMasters uses to assess whether a fleet of service vehicles is building cumulative brand recognition in the market. It measures four dimensions: visual consistency across the fleet, market saturation in the service area, alignment between the fleet and other brand touchpoints, and brand recall signals from customers. A fleet that scores well on all four dimensions is building a brand position, not just generating impressions.
- How is the Fleet Recognition Score different from the Wrap Readability Score?
- The Wrap Readability Score evaluates a single vehicle's wrap design for legibility at traffic speed. It measures whether the wrap communicates effectively in a three-second viewing window. The Fleet Recognition Score evaluates the entire fleet's ability to build cumulative brand recognition over time. A fleet can have high-readability wraps on every vehicle and still have a low Fleet Recognition Score if the vehicles are inconsistent with each other or concentrated in routes outside the target service area.
- How many vehicles are needed for a fleet to build brand recognition?
- There is no fixed number. The relevant variable is vehicles per square mile of service area during peak hours. A three-truck fleet with concentrated routes in a 10-mile radius can build stronger recognition than a 15-truck fleet spread across three counties with no geographic overlap. The goal is sufficient density that a typical prospect in the service area sees the brand more than once before a need arises.
- How long does it take for a fleet to reach the 'I see your trucks everywhere' recognition level?
- In a dense suburban market with a well-designed, consistent fleet of three or more vehicles, the 'see your trucks everywhere' response typically starts appearing in customer conversations within 12 to 24 months. The timeline compresses with more vehicles, more concentrated routing, and higher daily miles. It extends when vehicles have inconsistent liveries, operate in a wide geographic spread, or have designs that fail the readability test.
- What is the most common reason fleets fail to build brand recognition?
- Visual inconsistency across the fleet is the most common failure. When each vehicle looks different, different colors, different logo versions, different layouts, the impressions from different vehicles do not compound into recognition. The viewer encounters each vehicle as a new, unfamiliar brand rather than a repeat sighting of a known company. The second most common failure is routing: vehicles that spend significant daily miles in areas outside the target service area are generating impressions that cannot convert.
Don't be a stranger.
See where your current wrap is losing visibility. Upload a side or rear photo and get an instant 45 MPH Test visibility score. Free, no commitment.
New business or no wrap yet? Get started instead, no audit needed.